 |
ME 405: Mechatronics Portfolio
|


|
|
ME 405: Mechatronics Portfolio
|
|
Created on Thu Jan 28 08:08:33 2021. More...
Functions | |
| def | ButtonUI.processData (set1, set2) |
| Data Processing function More... | |
Variables | |
| bool | ButtonUI.firstFlag = True |
| Define flag to determine whether initial print statement should show. | |
| list | ButtonUI.Data = [] |
| Define an empty list to hold data during parsing in processData() | |
| ButtonUI.timeArray = array.array('i') | |
| Define an empty array to hold time data received from MCU through serial communication. | |
| ButtonUI.adcArray = array.array('i') | |
| Define an empty array to hold received voltage data corresponding to time in time array. | |
| ButtonUI.voltageArray = array.array('f') | |
| Define an empty array to hold voltage data after being converted from ADC counts to volts. | |
| ButtonUI.checkValid = None | |
| Define variable to hold signal that verifies whether data collection was successful or not. | |
| ButtonUI.port | |
| ButtonUI.baudrate | |
| ButtonUI.timeout | |
Created on Thu Jan 28 08:08:33 2021.
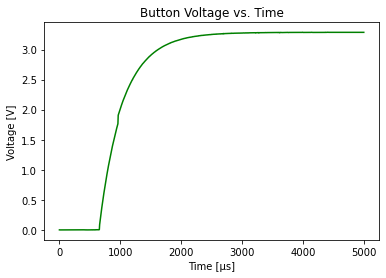
Front-end user interface for button response data collection
This front-end program is used to interface with a stm32 NUCLEO L476RG microcontroller in order to measure the response of a built-in button. The user is prompted to press 'g' on their keyboard to signify that they wish for data collection to be enabled, which is then forwarded to the NUCLEO via serial communication. They are then prompted to press the built-in button on the NUCLEO, during which time the NUCLEO collects data relating the ADC count of voltage for the button to time. The program then receives this data from the NUCLEO via serial communication, parses it, and plots it. Finally, the program exits, which displays the plots.
| def ButtonUI.processData | ( | set1, | |
| set2 | |||
| ) |
Data Processing function
This method is responsible for reading and interpreting the data sent in string format from the encoder. It strips return and newline statements from strings, splits according to the comma between time and position values, saves the newly combed data as a .csv file, and populates a two arrays which can then be plotted.